Lec. 06: Using GDB to Trace a Program
Table of Contents
1 Compiling with Debug Symbols
To use GDB to its fullest, we want to include the debug flags during
compilation. This enable us to view the code along side the
compilation process. So far, we've just been looking at the binary,
but we might want to actually track the progress of a program
line-by-line. Consider first the simple program datatype:
#include <stdio.h>
#include <math.h>

int main(){

  char c;
  short s;
  int a,i;
  float f;
  double d;


  c = 'a';
  s = 0x1001;
  f = 3.1415926 ;
  d = exp(exp(1));

  for(i=0;i<10;i++){
    printf("i:%d c:%c s:%d f:%f d:%f\n",
    i,c,s,f,d);
  }

}
If we were to compile this program, we might do something like this:
gcc datatype.c -o datatype
Which gives us the executable binary datatype, and we can run it to produce the expected output:
user@si485H-base:demo$ ./datatype
i:0 c:a s:4097 f:3.141593 d:15.154262
i:1 c:a s:4097 f:3.141593 d:15.154262
i:2 c:a s:4097 f:3.141593 d:15.154262
i:3 c:a s:4097 f:3.141593 d:15.154262
i:4 c:a s:4097 f:3.141593 d:15.154262
i:5 c:a s:4097 f:3.141593 d:15.154262
i:6 c:a s:4097 f:3.141593 d:15.154262
i:7 c:a s:4097 f:3.141593 d:15.154262
i:8 c:a s:4097 f:3.141593 d:15.154262
i:9 c:a s:4097 f:3.141593 d:15.154262
We can also trace the program with gdb and take a look at the output
(the -q just suppreses the welcome message):
user@si485H-base:demo$ gdb -q ./datatype
Reading symbols from ./datatype...(no debugging symbols found)...done.
(gdb) disassemble main
Dump of assembler code for function main:
   0x0804841d <+0>:	push   ebp
   0x0804841e <+1>:	mov    ebp,esp
   0x08048420 <+3>:	and    esp,0xfffffff0
   0x08048423 <+6>:	sub    esp,0x40
   0x08048426 <+9>:	mov    BYTE PTR [esp+0x3b],0x61
   0x0804842b <+14>:	mov    WORD PTR [esp+0x38],0x1001
   0x08048432 <+21>:	mov    eax,ds:0x804854c
   0x08048437 <+26>:	mov    DWORD PTR [esp+0x34],eax
   0x0804843b <+30>:	fld    QWORD PTR ds:0x8048550
   0x08048441 <+36>:	fstp   QWORD PTR [esp+0x28]
   0x08048445 <+40>:	mov    DWORD PTR [esp+0x3c],0x0
   0x0804844d <+48>:	jmp    0x804848a <main+109>
   0x0804844f <+50>:	fld    DWORD PTR [esp+0x34]
   0x08048453 <+54>:	movsx  edx,WORD PTR [esp+0x38]
   0x08048458 <+59>:	movsx  eax,BYTE PTR [esp+0x3b]
   0x0804845d <+64>:	fld    QWORD PTR [esp+0x28]
   0x08048461 <+68>:	fstp   QWORD PTR [esp+0x18]
   0x08048465 <+72>:	fstp   QWORD PTR [esp+0x10]
   0x08048469 <+76>:	mov    DWORD PTR [esp+0xc],edx
   0x0804846d <+80>:	mov    DWORD PTR [esp+0x8],eax
   0x08048471 <+84>:	mov    eax,DWORD PTR [esp+0x3c]
   0x08048475 <+88>:	mov    DWORD PTR [esp+0x4],eax
   0x08048479 <+92>:	mov    DWORD PTR [esp],0x8048530
   0x08048480 <+99>:	call   0x80482f0 <printf@plt>
   0x08048485 <+104>:	add    DWORD PTR [esp+0x3c],0x1
   0x0804848a <+109>:	cmp    DWORD PTR [esp+0x3c],0x9
   0x0804848f <+114>:	jle    0x804844f <main+50>
   0x08048491 <+116>:	leave
   0x08048492 <+117>:	ret
End of assembler dump.
(gdb)
But, if you look closely, you'll notice that we are missing the
debugging symbols, which further inform gdb about named values. This
means, line-by-line stepping of the program will not work. For
example, if I try and break at main and then take a step, it will
fail because gdb doesn't know what the next line of the source code
is.
(gdb) br main
Breakpoint 1 at 0x8048420
(gdb) r
Starting program: /home/user/git/si485-binary-exploits/lec/04/demo/datatype

Breakpoint 1, 0x08048420 in main ()
(gdb) n
Single stepping until exit from function main,
which has no line number information.
i:0 c:a s:4097 f:3.141593 d:15.154262
i:1 c:a s:4097 f:3.141593 d:15.154262
i:2 c:a s:4097 f:3.141593 d:15.154262
i:3 c:a s:4097 f:3.141593 d:15.154262
i:4 c:a s:4097 f:3.141593 d:15.154262
i:5 c:a s:4097 f:3.141593 d:15.154262
i:6 c:a s:4097 f:3.141593 d:15.154262
i:7 c:a s:4097 f:3.141593 d:15.154262
i:8 c:a s:4097 f:3.141593 d:15.154262
i:9 c:a s:4097 f:3.141593 d:15.154262
__libc_start_main (main=0x804841d <main>, argc=1, argv=0xbffff724, init=0x80484a0 <__libc_csu_init>, fini=0x8048510 <__libc_csu_fini>, rtld_fini=0xb7fed180 <_dl_fini>,
    stack_end=0xbffff71c) at libc-start.c:321
321	libc-start.c: No such file or directory.
(gdb)
All is not lost though, we can still work with just the binary without the debug symbols, which is an embedding of the program source in the binary. This is really important because for most of the programs we want to analyze from a security perspective, we will not have access to the debug symbols because most code is proprietary. It defeats the purpose to release debug compiled versions.
However, this is a class where we are specifically trying to learn how
to use GDB for both line-by-line and also by instrction. We might as
well include the debug symbols … for now. The gcc option to compile
with debug symbols is -g:
gcc -g datatype.c -o datatype
Now, when we run the program in gdb we can actually step through it:
user@si485H-base:demo$ gdb -q ./datatype
Reading symbols from ./datatype...done.
(gdb) br main
Breakpoint 1 at 0x8048426: file datatype.c, line 15.
(gdb) r
Starting program: /home/user/git/si485-binary-exploits/lec/04/demo/datatype

Breakpoint 1, main () at datatype.c:15
15	  c = 'a';
(gdb) n
16	  s = 0x1001;
(gdb) n
17	  f = 3.1415926 ;
(gdb) n
18	  d = exp(exp(1));
2 Source code line-by-line debugging with gdb
Now that we have a compiled binary with debug symbols, we can explore the process of line-by-line source code debugging. Here are the standard commands for iterating through a program:
breakorbrorb<linenum|function|*memaddress> : Set a break point where execution will halt at a given line number or function name. Additionally, we can set a break point at the memory address of an instruction.runorr<args> : run the program with the command line arguments args.continueorc<count> : continue the program until the next break point count times or program terminatesnextorn: execute the next line of the program and step over function callsstepors: execute the next line of the program and step into function callsfinish: finish the execution of the current function, or complete the current stack frameprintorp<var> : print the given variable and store the value in a gdb variablelist: display the current source code location
2.1 Run, Continue and Next
Let's get our hands dirty and see some of these commands in action
$ gdb -q ./datatypes
Reading symbols from ./datatypes...done.
(gdb) list
6 int main(){
7
8   char c;
9   short s;
10   int a,i;
11   float f;
12   double d;
13
14
15   c = 'a';
(gdb) br main
Breakpoint 1 at 0x8048426: file datatypes.c, line 15.
(gdb) r
Starting program: /home/user/git/si485-binary-exploits/lec/02/demos/datatypes

Breakpoint 1, main () at datatypes.c:15
15   c = 'a';
(gdb) n
16   s = 0x1001;
(gdb) p c
$1 = 97 'a'
(gdb) c
Continuing.
i:0 c:a s:4097 f:3.141593 d:15.154262
i:1 c:a s:4097 f:3.141593 d:15.154262
i:2 c:a s:4097 f:3.141593 d:15.154262
i:3 c:a s:4097 f:3.141593 d:15.154262
i:4 c:a s:4097 f:3.141593 d:15.154262
i:5 c:a s:4097 f:3.141593 d:15.154262
i:6 c:a s:4097 f:3.141593 d:15.154262
i:7 c:a s:4097 f:3.141593 d:15.154262
i:8 c:a s:4097 f:3.141593 d:15.154262
i:9 c:a s:4097 f:3.141593 d:15.154262
[Inferior 1 (process 6523) exited with code 042]
We then set a break point at the main function, so when we run the program, execution will halt at the first non-initializing code line in main(), namely the assignment of 'a' to c. After advancing to the next line, we can print the value of c, which is 'a'. Finally, we can continue the program to let it reach its conclusion.
Let's do it again, with a bit more advanced this time:
gdb) br main
Breakpoint 1 at 0x8048426: file datatypes.c, line 15.
(gdb) list 21
16   s = 0x1001;
17   f = 3.1415926 ;
18   d = exp(exp(1));
19
20   for(i=0;i<10;i++){
21     printf("i:%d c:%c s:%d f:%f d:%f\n",
22    i, c,s,f,d);
23   }
24
25 }
(gdb) b 21
Breakpoint 2 at 0x804844f: file datatypes.c, line 21.
(gdb) r
Starting program: /home/user/git/si485-binary-exploits/lec/02/demos/datatypes

Breakpoint 1, main () at datatypes.c:15
15   c = 'a';
(gdb) c
Continuing.

Breakpoint 2, main () at datatypes.c:21
21     printf("i:%d c:%c s:%d f:%f d:%f\n",
(gdb) c 3
Will ignore next 2 crossings of breakpoint 2.  Continuing.
i:0 c:a s:4097 f:3.141593 d:15.154262
i:1 c:a s:4097 f:3.141593 d:15.154262
i:2 c:a s:4097 f:3.141593 d:15.154262

Breakpoint 2, main () at datatypes.c:21
21     printf("i:%d c:%c s:%d f:%f d:%f\n",
(gdb) c
Continuing.
i:3 c:a s:4097 f:3.141593 d:15.154262

Breakpoint 2, main () at datatypes.c:21
21     printf("i:%d c:%c s:%d f:%f d:%f\n",
(gdb) c 10
Will ignore next 9 crossings of breakpoint 2.  Continuing.
i:4 c:a s:4097 f:3.141593 d:15.154262
i:5 c:a s:4097 f:3.141593 d:15.154262
i:6 c:a s:4097 f:3.141593 d:15.154262
i:7 c:a s:4097 f:3.141593 d:15.154262
i:8 c:a s:4097 f:3.141593 d:15.154262
i:9 c:a s:4097 f:3.141593 d:15.154262
[Inferior 1 (process 6546) exited with code 046]
This time we set a breakpoint in the for loop. So every iteration of the loop will result in a breakpoint. But, we can continue the loop for some number of breakpoint by using the count option to continue.
2.2 Stepping
So far we've been using the next option, but let's see what happens if we use step. The major difference is that next will step over functions, which means it will allow the function to execute without debugging. If we want to also debug the funciton, we need to step into the function. That is the step option.
(gdb) br 21
Breakpoint 1 at 0x804844f: file datatypes.c, line 21.
(gdb) r
Starting program: /home/user/git/si485-binary-exploits/lec/02/demos/datatypes

Breakpoint 1, main () at datatypes.c:21
21     printf("i:%d c:%c s:%d f:%f d:%f\n",
(gdb) s
__printf (format=0x8048530 "i:%d c:%c s:%d f:%f d:%f\n") at printf.c:28
28 printf.c: No such file or directory.
(gdb) list
23 in printf.c
When we try to step into printf, we find that we can but we don't have any debugging symbols. We only know that we are in printf.c. The reason for this is that printf comes from the stdio library, which is dynamically loaded into the program at run time. It is a separately compiled binary and it was not compiled with debugging symbols. BUT, we can still look at the assembly:
(gdb) disassemble printf
Dump of assembler code for function __printf:
=> 0xb7e684a0 <+0>: push   ebx
   0xb7e684a1 <+1>: sub    esp,0x18
   0xb7e684a4 <+4>: call   0xb7f4246b <__x86.get_pc_thunk.bx>
   0xb7e684a9 <+9>: add    ebx,0x15db57
   0xb7e684af <+15>: lea    eax,[esp+0x24]
   0xb7e684b3 <+19>: mov    DWORD PTR [esp+0x8],eax
   0xb7e684b7 <+23>: mov    eax,DWORD PTR [esp+0x20]
   0xb7e684bb <+27>: mov    DWORD PTR [esp+0x4],eax
   0xb7e684bf <+31>: mov    eax,DWORD PTR [ebx-0x70]
   0xb7e684c5 <+37>: mov    eax,DWORD PTR [eax]
   0xb7e684c7 <+39>: mov    DWORD PTR [esp],eax
   0xb7e684ca <+42>: call   0xb7e5e8c0 <_IO_vfprintf_internal>
   0xb7e684cf <+47>: add    esp,0x18
   0xb7e684d2 <+50>: pop    ebx
   0xb7e684d3 <+51>: ret
End of assembler dump.
We're only concerned with the source code debugging right now, so we
can get out of here by using the finish option, which will complete
the current function and break on return.
(gdb) finish
Run till exit from #0  __printf (format=0x8048530 "i:%d c:%c s:%d f:%f d:%f\n") at printf.c:37
main () at datatypes.c:20
20   for(i=0;i<10;i++){
Value returned is $1 = 38
3 Instruction Level Debugging
We have a similar set of gdb tools for stepping through programs at the instruction level as at the source level. Basic program control flow remains the same, but we now have additional commands:
nextiorni: move on to the next machine instruction, do not follow a callstepiorsi: move on to the next machine instruction, do follow a calldisassembleordisa<frame|function> : display disassembled instructions for the current frame or specified function (default current frame). (If you've set up your gdb environemnt, this can be further shorted tods)info regori r: show the current value of the registersx<address|expression> : examine the memoryinfo frameori f: show information about the current stack framebacktraceorbt: print trace of frames in stack from innermost to outermost
For these example, let's look at a program with a little bit more heft:
#include <stdio.h>

void print_n_times(char * str, int n){
  int i;

  for( i=0 ; i < n ; i++){
    printf("%s",str);
  }

}

int main(){

  int n;

  n = 5;

  print_n_times("Go Navy! Beat Army!\n",n);

  return 0;
}
3.1 Next Instruction and Examine
Starting with the basic, let's run the program print_n_times in
gdb with a break at main: (/note: that I'm using ds for
disassemble because I've set up the aliase in my gdb init file, see
the resource pages for how to do this/).
user@si485H-base:demo$ gdb -q ./print_n_times
Reading symbols from ./print_n_times...done.
(gdb) br main
Breakpoint 1 at 0x8048456: file print_n_times.c, line 16.
(gdb) r
Starting program: /home/user/git/si485-binary-exploits/lec/04/demo/print_n_times

Breakpoint 1, main () at print_n_times.c:16
16	  n = 5;
(gdb) ds
Dump of assembler code for function main:
   0x0804844d <+0>:	push   ebp
   0x0804844e <+1>:	mov    ebp,esp
   0x08048450 <+3>:	and    esp,0xfffffff0
   0x08048453 <+6>:	sub    esp,0x20
=> 0x08048456 <+9>:	mov    DWORD PTR [esp+0x1c],0x5
   0x0804845e <+17>:	mov    eax,DWORD PTR [esp+0x1c]
   0x08048462 <+21>:	mov    DWORD PTR [esp+0x4],eax
   0x08048466 <+25>:	mov    DWORD PTR [esp],0x8048513
   0x0804846d <+32>:	call   0x804841d <print_n_times>
   0x08048472 <+37>:	mov    eax,0x0
   0x08048477 <+42>:	leave
   0x08048478 <+43>:	ret
End of assembler dump.
(gdb)
Much like source code tracing, gdb is now showing the specific instruction that is being executed. You may also notice that gdb skipped over the function frame setup routines … that can be traced too, if we really want, but let's not focus on that right now.
We can now look at the state of the program in a bit more detail, starting with the sate of the registers:
(gdb) i r
eax            0x1	1
ecx            0x7669b348	1986638664
edx            0xbffff6b4	-1073744204
ebx            0xb7fc5000	-1208201216
esp            0xbffff660	0xbffff660
ebp            0xbffff688	0xbffff688
esi            0x0	0
edi            0x0	0
eip            0x8048456	0x8048456 <main+9>
eflags         0x286	[ PF SF IF ]
cs             0x73	115
ss             0x7b	123
ds             0x7b	123
es             0x7b	123
fs             0x0	0
gs             0x33	51
The register we are concerned with is the eip register, or the
instruction pointer, and you see that it is reference 0x8048456, or
<main+9>, which matches the current instruction makred with an
=>. We can go further, but inspecting this address using the x
command:
(gdb) x $eip
0x8048456 <main+9>:	0x1c2444c7
Interestingly, that doesn't look like an address; it's a 4-byte hex
value. Even though gdb correctly identified the offset of the address
from main it wants to show you the address in the most raw
form. However, we can ask gdb to change it's preesentation of that
memory, this time showing the bytes as an x86 instruction:
(gdb) x/i $eip
=> 0x8048456 <main+9>:	mov    DWORD PTR [esp+0x1c],0x5
And that's more like it.
Moving on in the program, we see that the current instruction is going to write the value 0x5 to the stack at an offset from the stack pointer of 0x16. Let's execute the instruction and use examine to see that this did in fact occur:
(gdb) ni
18	  print_n_times("Go Navy! Beat Army!\n",n);
(gdb) ds
Dump of assembler code for function main:
   0x0804844d <+0>:	push   ebp
   0x0804844e <+1>:	mov    ebp,esp
   0x08048450 <+3>:	and    esp,0xfffffff0
   0x08048453 <+6>:	sub    esp,0x20
   0x08048456 <+9>:	mov    DWORD PTR [esp+0x1c],0x5
=> 0x0804845e <+17>:	mov    eax,DWORD PTR [esp+0x1c]
   0x08048462 <+21>:	mov    DWORD PTR [esp+0x4],eax
   0x08048466 <+25>:	mov    DWORD PTR [esp],0x8048513
   0x0804846d <+32>:	call   0x804841d <print_n_times>
   0x08048472 <+37>:	mov    eax,0x0
   0x08048477 <+42>:	leave
   0x08048478 <+43>:	ret
End of assembler dump.
(gdb)  x $esp+0x1c
   0xbffff67c:	add    eax,0x80000000
The next instruction moves the value from the stack and puts it in the eax register. Let's continue with the next instruction and see the states of the eax register:
(gdb) ni
0x08048462	18	  print_n_times("Go Navy! Beat Army!\n",n);
(gdb) i r eax
eax            0x5	5
(gdb) p/x $eax
$1 = 0x5
Note, we can inspect the register either with the info reg command
(shortened to i r here) or with the print command, shorted to p. I
used the extra x in p/x to say print the value of the register in
hex.
The next instructoin, takes the value in eax, namely 0x5, and writes
to the address 4-bytes above the stack pointer:
(gdb) ds
Dump of assembler code for function main:
   0x0804844d <+0>:	push   ebp
   0x0804844e <+1>:	mov    ebp,esp
   0x08048450 <+3>:	and    esp,0xfffffff0
   0x08048453 <+6>:	sub    esp,0x20
   0x08048456 <+9>:	mov    DWORD PTR [esp+0x1c],0x5
   0x0804845e <+17>:	mov    eax,DWORD PTR [esp+0x1c]
=> 0x08048462 <+21>:	mov    DWORD PTR [esp+0x4],eax
   0x08048466 <+25>:	mov    DWORD PTR [esp],0x8048513
   0x0804846d <+32>:	call   0x804841d <print_n_times>
   0x08048472 <+37>:	mov    eax,0x0
   0x08048477 <+42>:	leave
   0x08048478 <+43>:	ret
End of assembler dump.
(gdb) ni
0x08048466	18	  print_n_times("Go Navy! Beat Army!\n",n);
(gdb) i r eax
eax            0x5	5
(gdb) x/x $esp+0x4
0xbffff664:	0x00000005
Good, Continuing on (ni) we see that the value 0x8048513 is written to the memory address at the top of the stack.
(gdb) ds
Dump of assembler code for function main:
   0x0804844d <+0>:	push   ebp
   0x0804844e <+1>:	mov    ebp,esp
   0x08048450 <+3>:	and    esp,0xfffffff0
   0x08048453 <+6>:	sub    esp,0x20
   0x08048456 <+9>:	mov    DWORD PTR [esp+0x1c],0x5
   0x0804845e <+17>:	mov    eax,DWORD PTR [esp+0x1c]
   0x08048462 <+21>:	mov    DWORD PTR [esp+0x4],eax
=> 0x08048466 <+25>:	mov    DWORD PTR [esp],0x8048513
   0x0804846d <+32>:	call   0x804841d <print_n_times>
   0x08048472 <+37>:	mov    eax,0x0
   0x08048477 <+42>:	leave
   0x08048478 <+43>:	ret
End of assembler dump.
(gdb) ni
0x0804846d	18	  print_n_times("Go Navy! Beat Army!\n",n);
(gdb) x/x $esp
0xbffff660:	0x08048513
(gdb)
What is 0x8048513? It is the memory address of the string "Go Navy! Beat Army!\n" and we can see this by examining the memory address.
(gdb) x/x 0x08048513
0x8048513:	0x4e206f47
The initial examine will just display the values in hex, but if you look closely you see that this is ASCII. We can get gdb to display this a little more clearly with more options to examine:
(gdb) x/21b 0x08048513
0x8048513:	0x47	0x6f	0x20	0x4e	0x61	0x76	0x79	0x21
0x804851b:	0x20	0x42	0x65	0x61	0x74	0x20	0x41	0x72
0x8048523:	0x6d	0x79	0x21	0x0a	0x00
This time I use the b option, which says to print single byte
values, and now we see each of the bytes all the way up to the NULL at
the end. Let's go one step further, and using the bc option which
shows the bytes and the ASCII char values.
(gdb) x/21bc 0x08048513
0x8048513:	71 'G'	111 'o'	32 ' '	78 'N'	97 'a'	118 'v'	121 'y'	33 '!'
0x804851b:	32 ' '	66 'B'	101 'e'	97 'a'	116 't'	32 ' '	65 'A'	114 'r'
0x8048523:	109 'm'	121 'y'	33 '!'	10 '\n'	0 '\000'
Now, the string is mostly revealed. We can go further and just treat
the address as a char * and print the string directly with the s
option:
(gdb) x/s 0x08048513
0x8048513:	"Go Navy! Beat Army!\n"
As you can see, examine is a very powerful command that can show data in many different formats. If we look at the different formats for examine, we have a lot of options:
x[/Nuf]: where N is the number of u unit size display and f is a formatucan be the followingb: byteh: half word (2 bytes)w: word (4 bytes)g: giant word (8 bytes)
fcan be any print format, pluss: null-terminated stringi: machine instruction
3.2 Step Instruction and Stack Frames
At this point in the trace, we are about to call print_n_times()
function, so lets step into that function with the step
instruction or si command:
(gdb) ds
Dump of assembler code for function main:
   0x0804844d <+0>:	push   ebp
   0x0804844e <+1>:	mov    ebp,esp
   0x08048450 <+3>:	and    esp,0xfffffff0
   0x08048453 <+6>:	sub    esp,0x20
   0x08048456 <+9>:	mov    DWORD PTR [esp+0x1c],0x5
   0x0804845e <+17>:	mov    eax,DWORD PTR [esp+0x1c]
   0x08048462 <+21>:	mov    DWORD PTR [esp+0x4],eax
   0x08048466 <+25>:	mov    DWORD PTR [esp],0x8048513
=> 0x0804846d <+32>:	call   0x804841d <print_n_times>
   0x08048472 <+37>:	mov    eax,0x0
   0x08048477 <+42>:	leave
   0x08048478 <+43>:	ret
End of assembler dump.
(gdb) si
print_n_times (str=0x8048513 "Go Navy! Beat Army!\n", n=5) at print_n_times.c:3
3	void print_n_times(char * str, int n){
(gdb) ds
Dump of assembler code for function print_n_times:
=> 0x0804841d <+0>:	push   ebp
   0x0804841e <+1>:	mov    ebp,esp
   0x08048420 <+3>:	sub    esp,0x28
   0x08048423 <+6>:	mov    DWORD PTR [ebp-0xc],0x0
   0x0804842a <+13>:	jmp    0x8048443 <print_n_times+38>
   0x0804842c <+15>:	mov    eax,DWORD PTR [ebp+0x8]
   0x0804842f <+18>:	mov    DWORD PTR [esp+0x4],eax
   0x08048433 <+22>:	mov    DWORD PTR [esp],0x8048510
   0x0804843a <+29>:	call   0x80482f0 <printf@plt>
   0x0804843f <+34>:	add    DWORD PTR [ebp-0xc],0x1
   0x08048443 <+38>:	mov    eax,DWORD PTR [ebp-0xc]
   0x08048446 <+41>:	cmp    eax,DWORD PTR [ebp+0xc]
   0x08048449 <+44>:	jl     0x804842c <print_n_times+15>
   0x0804844b <+46>:	leave
   0x0804844c <+47>:	ret
End of assembler dump.
(gdb)
We have now stepped out of the main function and into the
print_n_times instruction. The call instruction that got is here
does two things. It will first save the next instruction after the
call on the stack via a push and then it will transfer control to the
called address. The reason the next instruction is saved is that
after a return, control continue after the function call. So if we ere
to look at the top of the stack right now, we'll that it references
the instruction at <main+37>:
(gdb) x/wx $esp
0xbffff65c:	0x08048472
(gdb) x/i 0x08048472
   0x8048472 <main+37>:	mov    eax,0x0
What about the variables for print_n_times() function? If we look at
the instruction prior to the call, you see that we wrote the address
of the string to be printed at the top of the stack. That means, the
next items above (higher in the address space) from the stack pointer
will be the arguments to the function:
(gdb) x/3wx $esp
0xbffff65c:	0x08048472	0x08048513	0x00000005
(gdb) x/s 0x08048513
0x8048513:	"Go Navy! Beat Army!\n"
Now, looking back at where are in the instructions of the function, we see the familiar setup for the stack frame. First, we must save the old base pointer, and set the new base pointer to the top of the stack. This is often called the saved frame pointer or (sfp). Let's execute these and see where we are at:
(gdb) ds
Dump of assembler code for function print_n_times:
=> 0x0804841d <+0>:	push   ebp
   0x0804841e <+1>:	mov    ebp,esp
   0x08048420 <+3>:	sub    esp,0x28
   0x08048423 <+6>:	mov    DWORD PTR [ebp-0xc],0x0
   0x0804842a <+13>:	jmp    0x8048443 <print_n_times+38>
   0x0804842c <+15>:	mov    eax,DWORD PTR [ebp+0x8]
   0x0804842f <+18>:	mov    DWORD PTR [esp+0x4],eax
   0x08048433 <+22>:	mov    DWORD PTR [esp],0x8048510
   0x0804843a <+29>:	call   0x80482f0 <printf@plt>
   0x0804843f <+34>:	add    DWORD PTR [ebp-0xc],0x1
   0x08048443 <+38>:	mov    eax,DWORD PTR [ebp-0xc]
   0x08048446 <+41>:	cmp    eax,DWORD PTR [ebp+0xc]
   0x08048449 <+44>:	jl     0x804842c <print_n_times+15>
   0x0804844b <+46>:	leave
   0x0804844c <+47>:	ret
End of assembler dump.
(gdb) ni
0x0804841e	3	void print_n_times(char * str, int n){
(gdb) ni
0x08048420	3	void print_n_times(char * str, int n){
(gdb) ni
6	  for( i=0 ; i < n ; i++){
(gdb) ds
Dump of assembler code for function print_n_times:
   0x0804841d <+0>:	push   ebp
   0x0804841e <+1>:	mov    ebp,esp
   0x08048420 <+3>:	sub    esp,0x28
=> 0x08048423 <+6>:	mov    DWORD PTR [ebp-0xc],0x0
   0x0804842a <+13>:	jmp    0x8048443 <print_n_times+38>
   0x0804842c <+15>:	mov    eax,DWORD PTR [ebp+0x8]
   0x0804842f <+18>:	mov    DWORD PTR [esp+0x4],eax
   0x08048433 <+22>:	mov    DWORD PTR [esp],0x8048510
   0x0804843a <+29>:	call   0x80482f0 <printf@plt>
   0x0804843f <+34>:	add    DWORD PTR [ebp-0xc],0x1
   0x08048443 <+38>:	mov    eax,DWORD PTR [ebp-0xc]
   0x08048446 <+41>:	cmp    eax,DWORD PTR [ebp+0xc]
   0x08048449 <+44>:	jl     0x804842c <print_n_times+15>
   0x0804844b <+46>:	leave
   0x0804844c <+47>:	ret
End of assembler dump.
At this point we have saved the old base pointer. The new base pointer references the start of the stack for this stack frame, and we've allocated 0x28 additional bytes on the stack by subtracting from the stack pointer.
The next parts here should be familiar, we are working a for loop. One thing that is different the last time we did this is that assembly mixes between referring to items in the stack in offsets from the base pointer and the stack pointer. Using our newly trained eye we can see that:
ebp-0xc: this is the variable iebp+0x8: this is the variable str passed as an argumentebp+0xc: this is the variable nesp: First argument to printf() : address of "%s"esp+0x4: Second argument to printf() : address of "Go Navy! Beat Army!"
We can see this visually like so at the point:
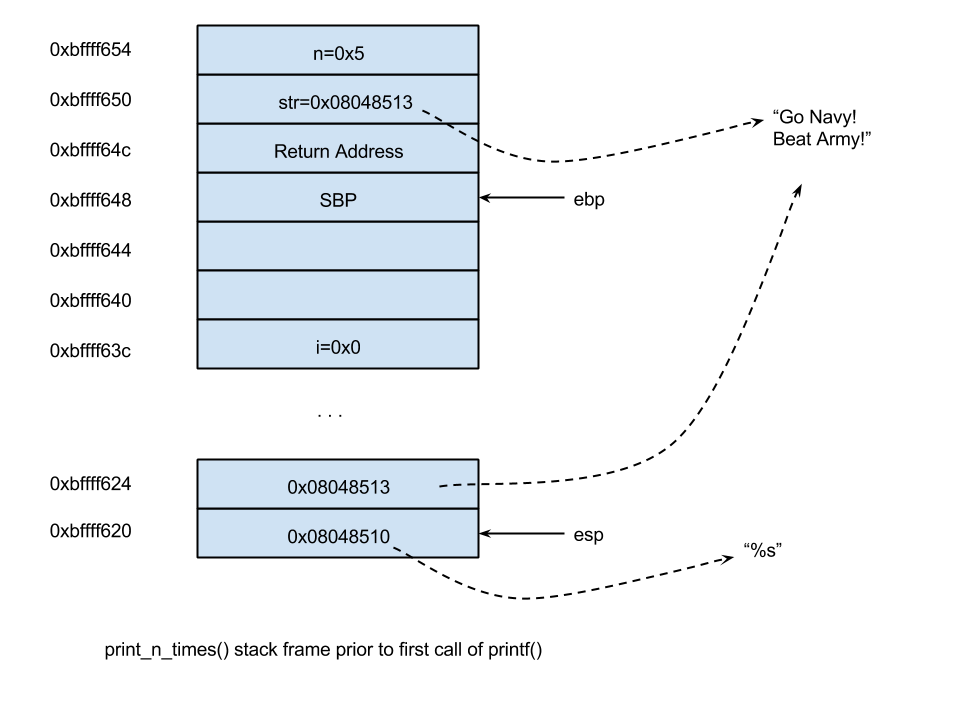
And if we can also inspect this within gdb by examining from the stack pointer going backward. This is the stack right before the call to printf():
(gdb) ds
Dump of assembler code for function print_n_times:
   0x0804841d <+0>:	push   ebp
   0x0804841e <+1>:	mov    ebp,esp
   0x08048420 <+3>:	sub    esp,0x28
   0x08048423 <+6>:	mov    DWORD PTR [ebp-0xc],0x0
   0x0804842a <+13>:	jmp    0x8048443 <print_n_times+38>
   0x0804842c <+15>:	mov    eax,DWORD PTR [ebp+0x8]
   0x0804842f <+18>:	mov    DWORD PTR [esp+0x4],eax
   0x08048433 <+22>:	mov    DWORD PTR [esp],0x8048510
=> 0x0804843a <+29>:	call   0x80482f0 <printf@plt>
   0x0804843f <+34>:	add    DWORD PTR [ebp-0xc],0x1
   0x08048443 <+38>:	mov    eax,DWORD PTR [ebp-0xc]
   0x08048446 <+41>:	cmp    eax,DWORD PTR [ebp+0xc]
   0x08048449 <+44>:	jl     0x804842c <print_n_times+15>
   0x0804844b <+46>:	leave
   0x0804844c <+47>:	ret
End of assembler dump.
(gdb) i r esp
esp            0xbffff630	0xbffff630
(gdb) i r ebp
ebp            0xbffff658	0xbffff658
(gdb) x/14wx $esp
0xbffff630:	0x08048510	0x08048513	0xb7e27bf8	0xb7e4e273
0xbffff640:	0x00000000	0x00ca0000	0x00000001	0x00000000
0xbffff650:	0xbffff844	0x0000002f	0xbffff688	0x08048472
0xbffff660:	0x08048513	0x00000005
3.3 Backtrace and Info
It's a little verbose to examine the stack in this manner and so gdb provides some easier ways to inspect the stack. The first is a backtrace:
(gdb) bt
#0  0x0804843a in print_n_times (str=0x8048513 "Go Navy! Beat Army!\n", n=5) at print_n_times.c:7
#1  0x08048472 in main () at print_n_times.c:18
The backtrace will show you the frames going backwards. Above, main called printntimes, so we have two frames. The 0 frame is always the current one.
Additionally the info tools are really, really helpful. We've seen the info registers, but you can alss use info to inspect the frame:
(gdb) info frame
Stack level 0, frame at 0xbffff660:
 eip = 0x804843a in print_n_times (print_n_times.c:7); saved eip = 0x8048472
 called by frame at 0xbffff690
 source language c.
 Arglist at 0xbffff658, args: str=0x8048513 "Go Navy! Beat Army!\n", n=5
 Locals at 0xbffff658, Previous frame's sp is 0xbffff660
 Saved registers:
  ebp at 0xbffff658, eip at 0xbffff65c